Analytics and performance reporting
6 min read
Two screens, two questions. Analytics asks how the messaging is doing; Performance asks how the team is doing.
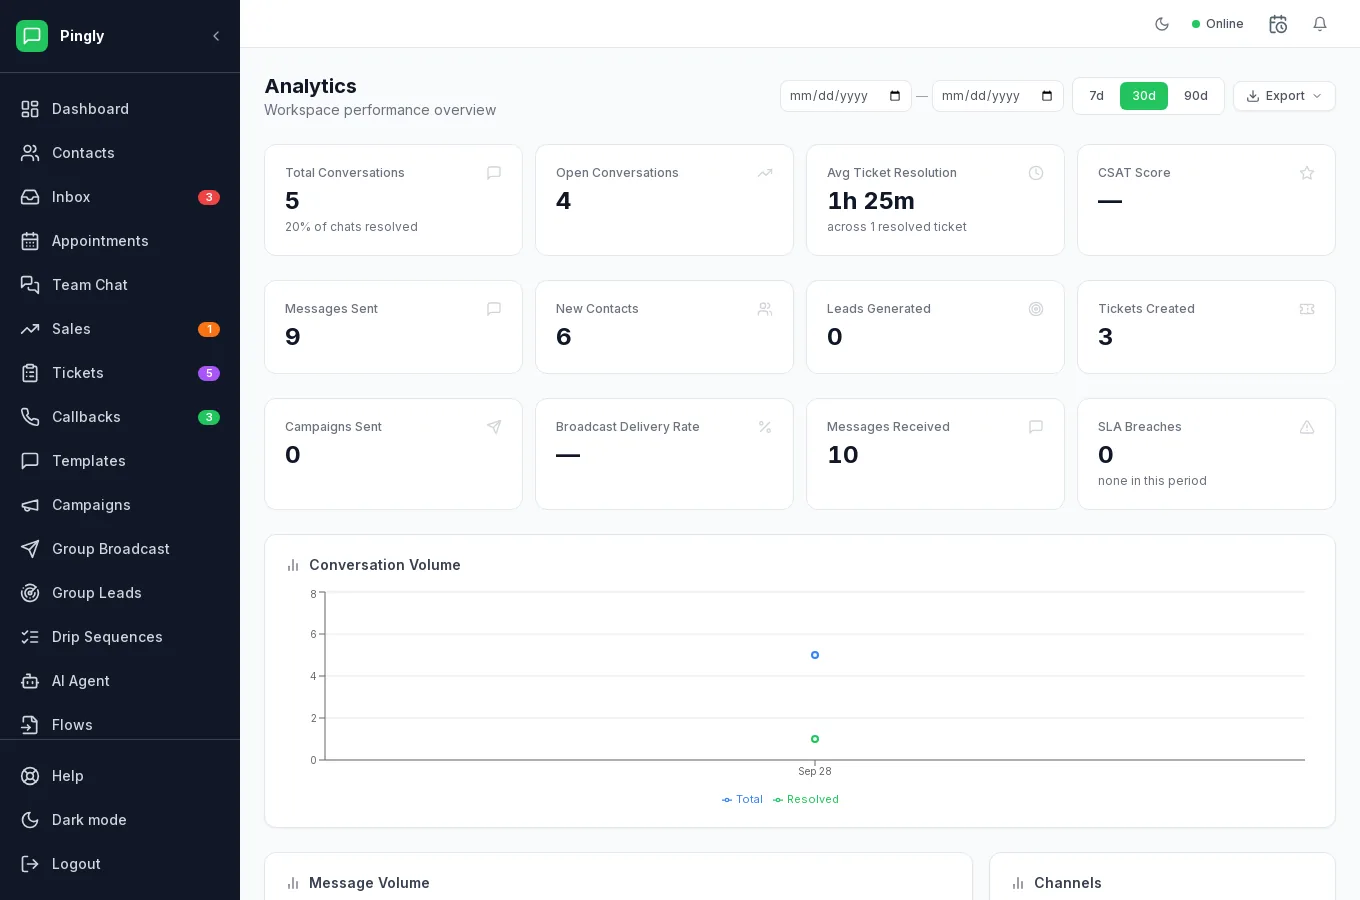
Analytics
The cards across the top, over the period you choose (7, 30 or 90 days):
| Card | What it tells you | Watch for |
|---|---|---|
| Total Conversations | How many chats happened, with the share resolved. | Resolved share falling means the queue is growing. |
| Messages Sent | Outbound volume. | Climbing while Messages Received stays flat — you are broadcasting, not conversing. |
| Messages Received | Inbound volume. The healthier number of the two. | |
| Broadcast Delivery Rate | How much of your campaign traffic arrived. | Below about 90% usually means a list problem, not a Pingly one. |
| Avg Ticket Resolution | How long tickets take to close. | |
| CSAT Score | Satisfaction, where you collect it. | Blank until ratings come in. |
| New Contacts | People who arrived in the period. | |
| Leads Generated | Leads created in the period. | |
| SLA Breaches | Conversations that missed their deadline. | Anything above zero is worth a look. |
Below the cards are Conversation Volume, Message Volumeand Channels charts, and an Export button.
Performance
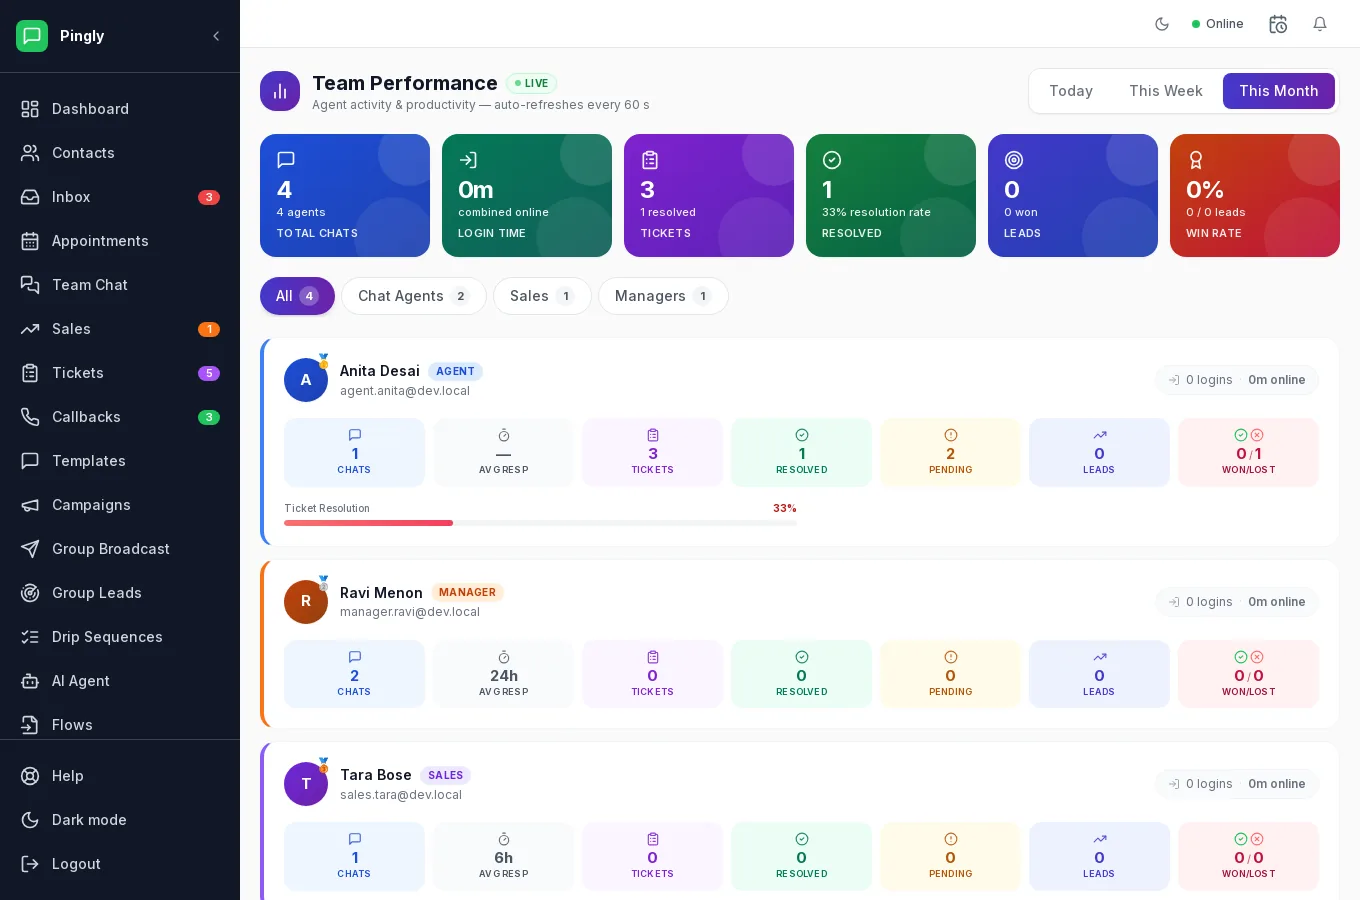
Pick Today, This Week or This Month, and filter to Chat Agents, Sales or Managers. Each person gets a row:
| Column | What it tells you |
|---|---|
| Chats | Conversations handled. Read it next to response time, never on its own. |
| Avg Resp | How long a customer waits for a reply. The single best predictor of whether they stay. |
| Tickets | Tickets they own. |
| Resolved | Tickets they closed. |
| Pending | Still open on them — whether the queue is being cleared or quietly growing. |
| Leads | Leads they own. |
| Won / Lost | Closed deals either way, with a win rate across the top. |
| Login time | How long they were online. Context for the rest, not a measure on its own. |
The screen is marked LIVE and refreshes itself every 60 seconds.
Agents and sales users get My Performance — the same figures for themselves only.